
You haven't signed in yet, you can have a better experience after signing in
*Please complete the payment within {{receiveCouponInfo.expire_at}}Previous use*
You haven't signed in yet, you can have a better experience after signing in
 JProfiler Java Performance Analysis and Optimization Tool Software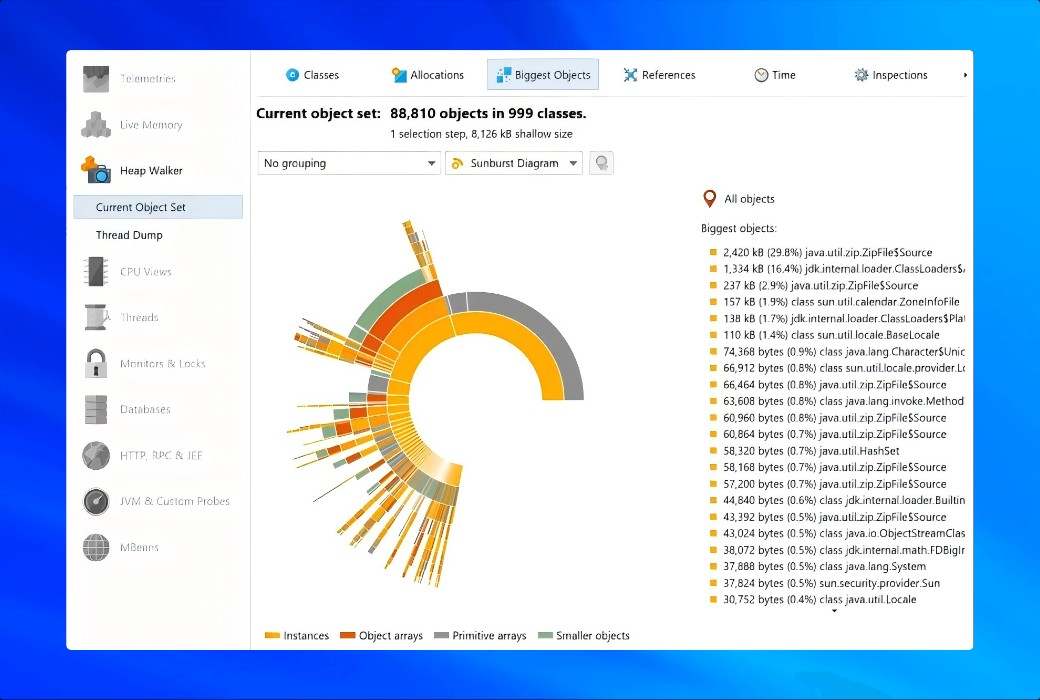


Activity Rules
1、Activity time:{{ info.groupon.start_at }} ~ {{ info.groupon.end_at }}。
1、Activity time:cease when sold out。
2、Validity period of the Group Buying:{{ info.groupon.expire_days * 24 }} hours。
3、Number of Group Buying:{{ info.groupon.need_count }}x。
Please Pay Attention
1、Teamwork process: Join/initiate a Group Buying and make a successful payment - Within the validity period, the number of team members meets the activity requirements - Group Buying succeeded!
2、If the number of participants cannot be met within the valid period, the group will fail, and the paid amount will be refunded in the original way.
3、The number of people required and the time of the event may vary among different products. Please pay attention to the rules of the event.
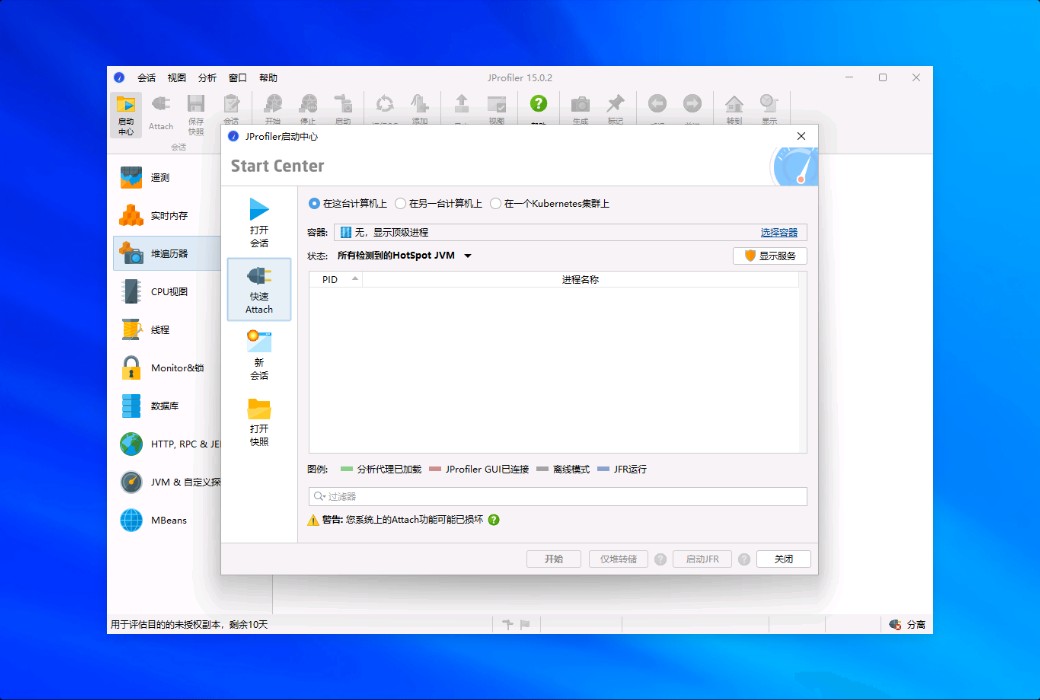
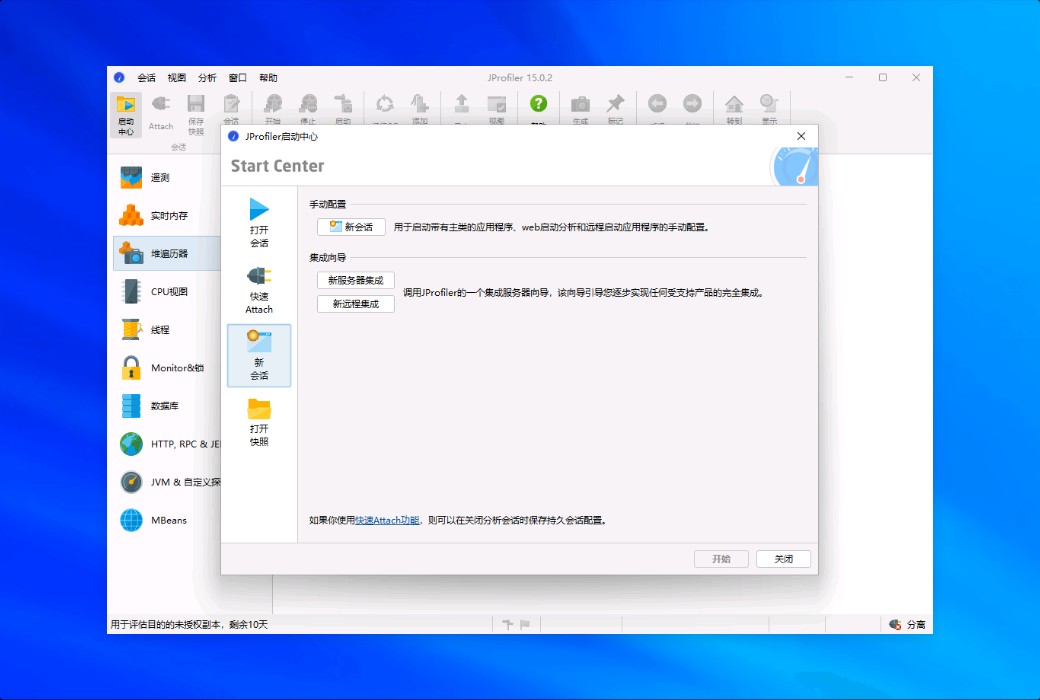
JProfiler - a leading Java parser for deep JVM analysis
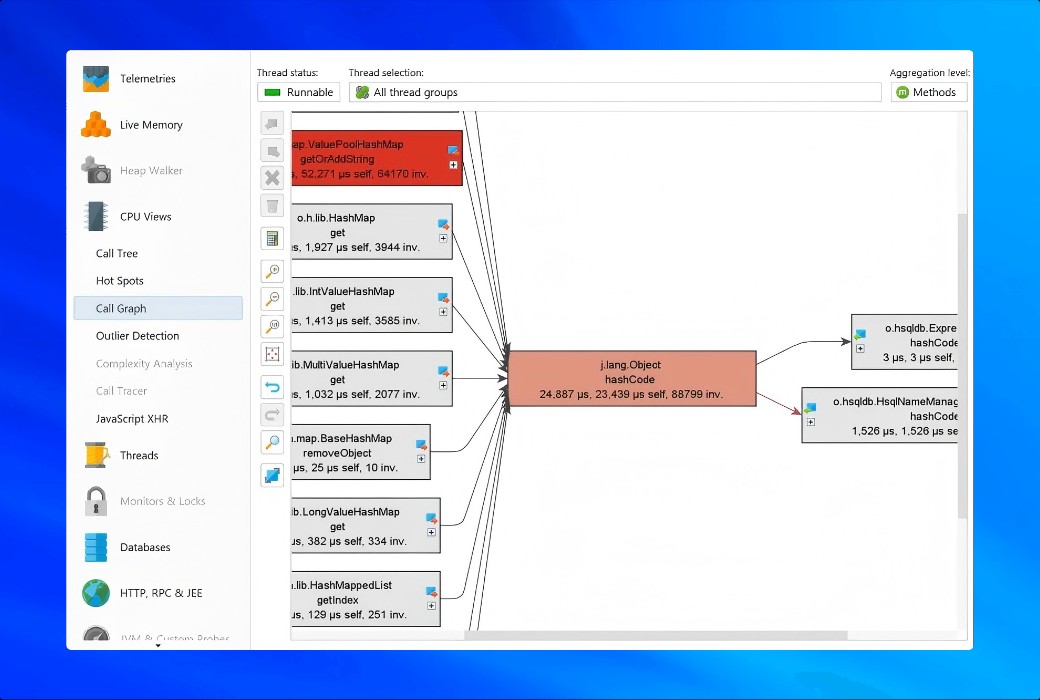
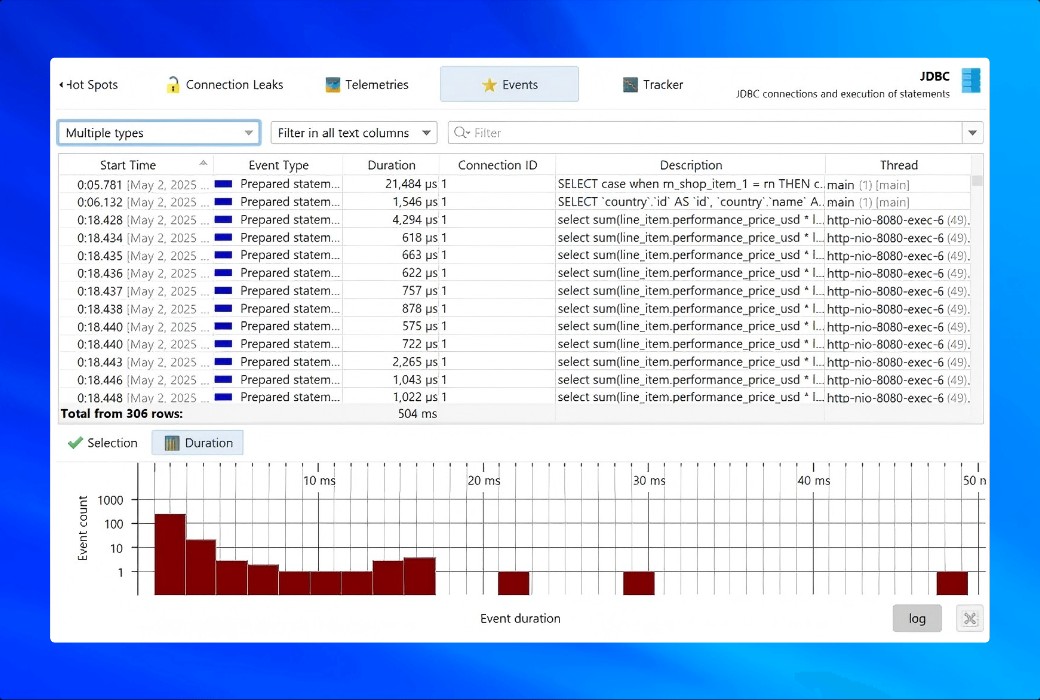
JProfiler connects advanced analytics and low-level JVM data, providing unparalleled insights to address the most challenging performance issues, memory leaks, threading problems, and higher-level issues in technologies such as JDBC and JPA.
Why choose JPProfiler?
Functions and features
One of JProfiler's advanced probes measures MongoDB calls. Compared to using a simple parser that only displays method calls, the problem-solving speed is much faster.
The detection of Kafka producers and consumers provides event based aggregated data for debugging Kafka and quickly fixing performance issues.
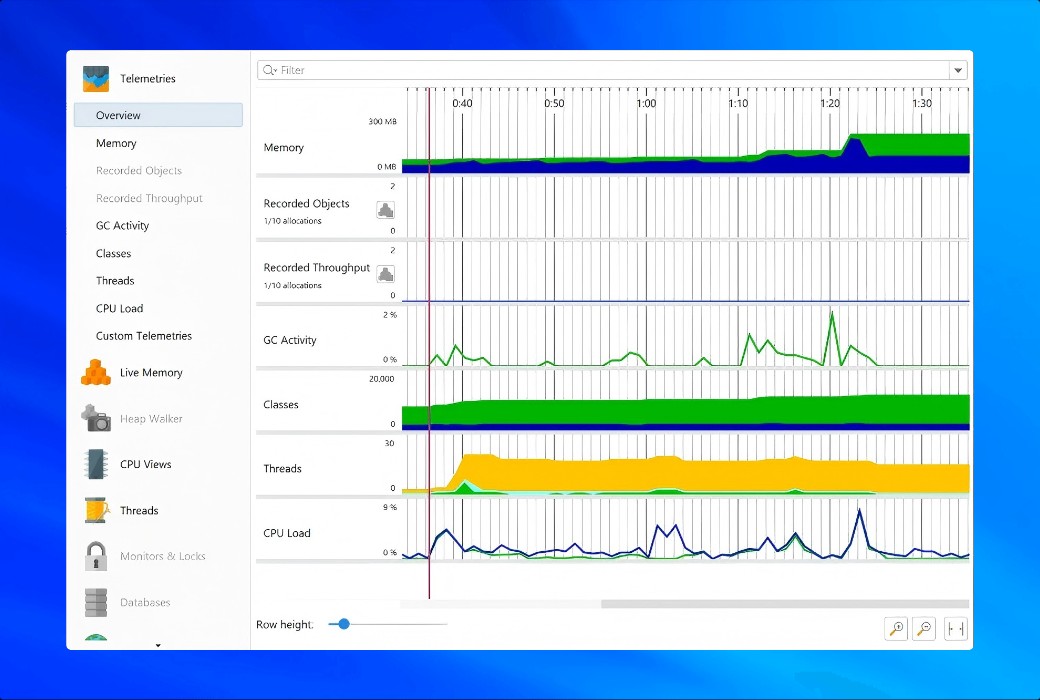
With JProfiler, you don't have to record everything before seeing the results. The UI will display analysis data in real-time when feasible.
JProfiler offers discounted IDE plugins for IntelliJ IDEA, VS Code, Eclipse, and Netbeans. Just click once to start analyzing the session and automatically focus on your own code.
Analysis without UI is easy to perform offline analysis Use trigger systems or APIs to automatically record data and save snapshots.
Save and compare analysis snapshots to understand performance changes between analysis runs.
Tracking memory leaks is difficult. JProfiler's heap walker uses the most advanced memory analysis tools to make everything simple.
Directly analyze native memory snapshots from HotSpot JVM (HPROF) and OpenJ9 (PHD) in the heap walker.
Utilize all the features of JProfiler to record and analyze JFR snapshots. Ideal choice for production environment.
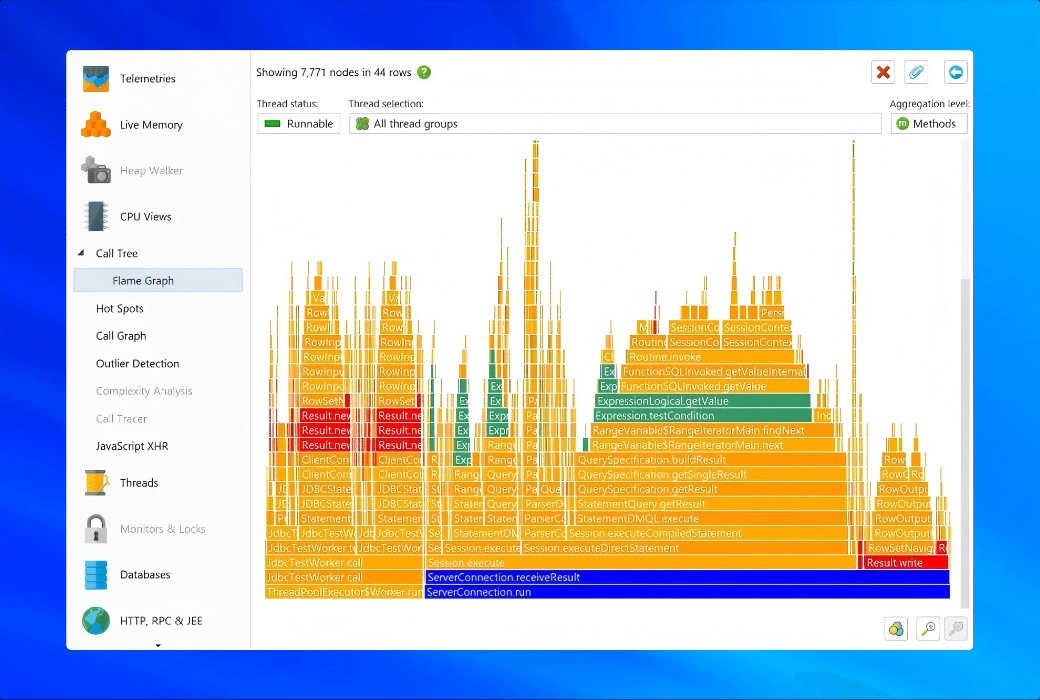
Track cross thread calls by supporting actuators, virtual threads, AWT, SWT, Kotlin coroutines, and more.
Track calls across JVM boundaries, including HTTP, RMI, GRPC, Web services, and remote EJs.
Define custom probes directly in the UI using scripts. For advanced use cases, please use embedded or injected probe APIs.
Official Website:https://www.ej-technologies.com/jProfiler
Download Center:https://jProfiler.apsgo.cn
Shipping Time: 24-hour manual processing and shipping
Operating Platforms: Windows, macOS, Linux
Interface Language: Supports Chinese interface display, with multiple languages available.
Update Instructions: Varies depending on the purchased version.
Trial Before Purchase: Free trial for 10 days before purchase.
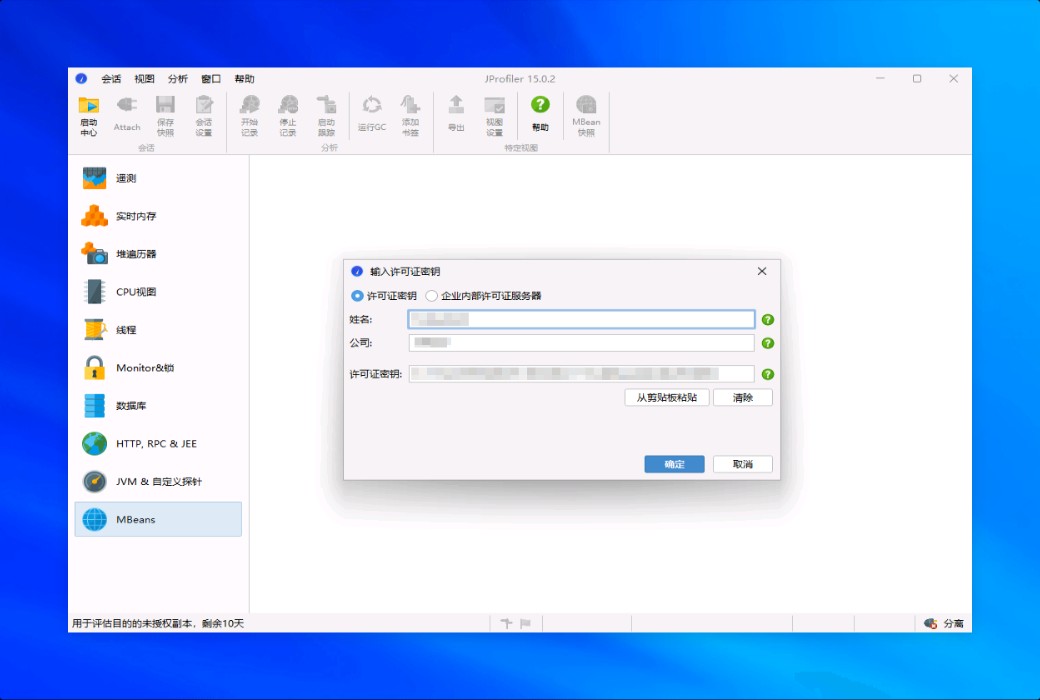
How to Receive Your Order: After purchase, activation information will be sent to the email address used for the order. You can also view the corresponding product activation code in your personal center, under "My Orders".
Number of Devices: Varies depending on the purchased version.
Changing Computers: Uninstall on the original computer and activate on the new one.
Activation Guide: To be added.
Special Instructions: To be added.
References:https://www.ej-technologies.com/jProfiler

Any question